Quantitative Trading Project
Quantitative trading project implementing strategies mentioned in the book “Algorithmic Traading” by Ernest P. Chan.
Overview
- Goal: To implement a mean reversion trading strategy using cointegrated stocks
- 15 constructed portfolios had a better Sharpe Ratio than benchmark (SPY)
- Best Result (BKNG and SIRI):
- Return: 79.47% (compared to 47.13% return of SPY)
- Sharpe Ratio: 1.56 (compared 0.68)
- Beta: 0.03 (uncorrelated returns to the market)
- Max Drawdown: -9.76% (compared to benchmark, -33.72%)
Tools
- Pandas
- Backtrader
- Quantstats
- Sqlite
Step 1: Cointegration Test
First, the data was split into training and testing:
- Training period: 2014-2017
- Testing period: 2018-2020
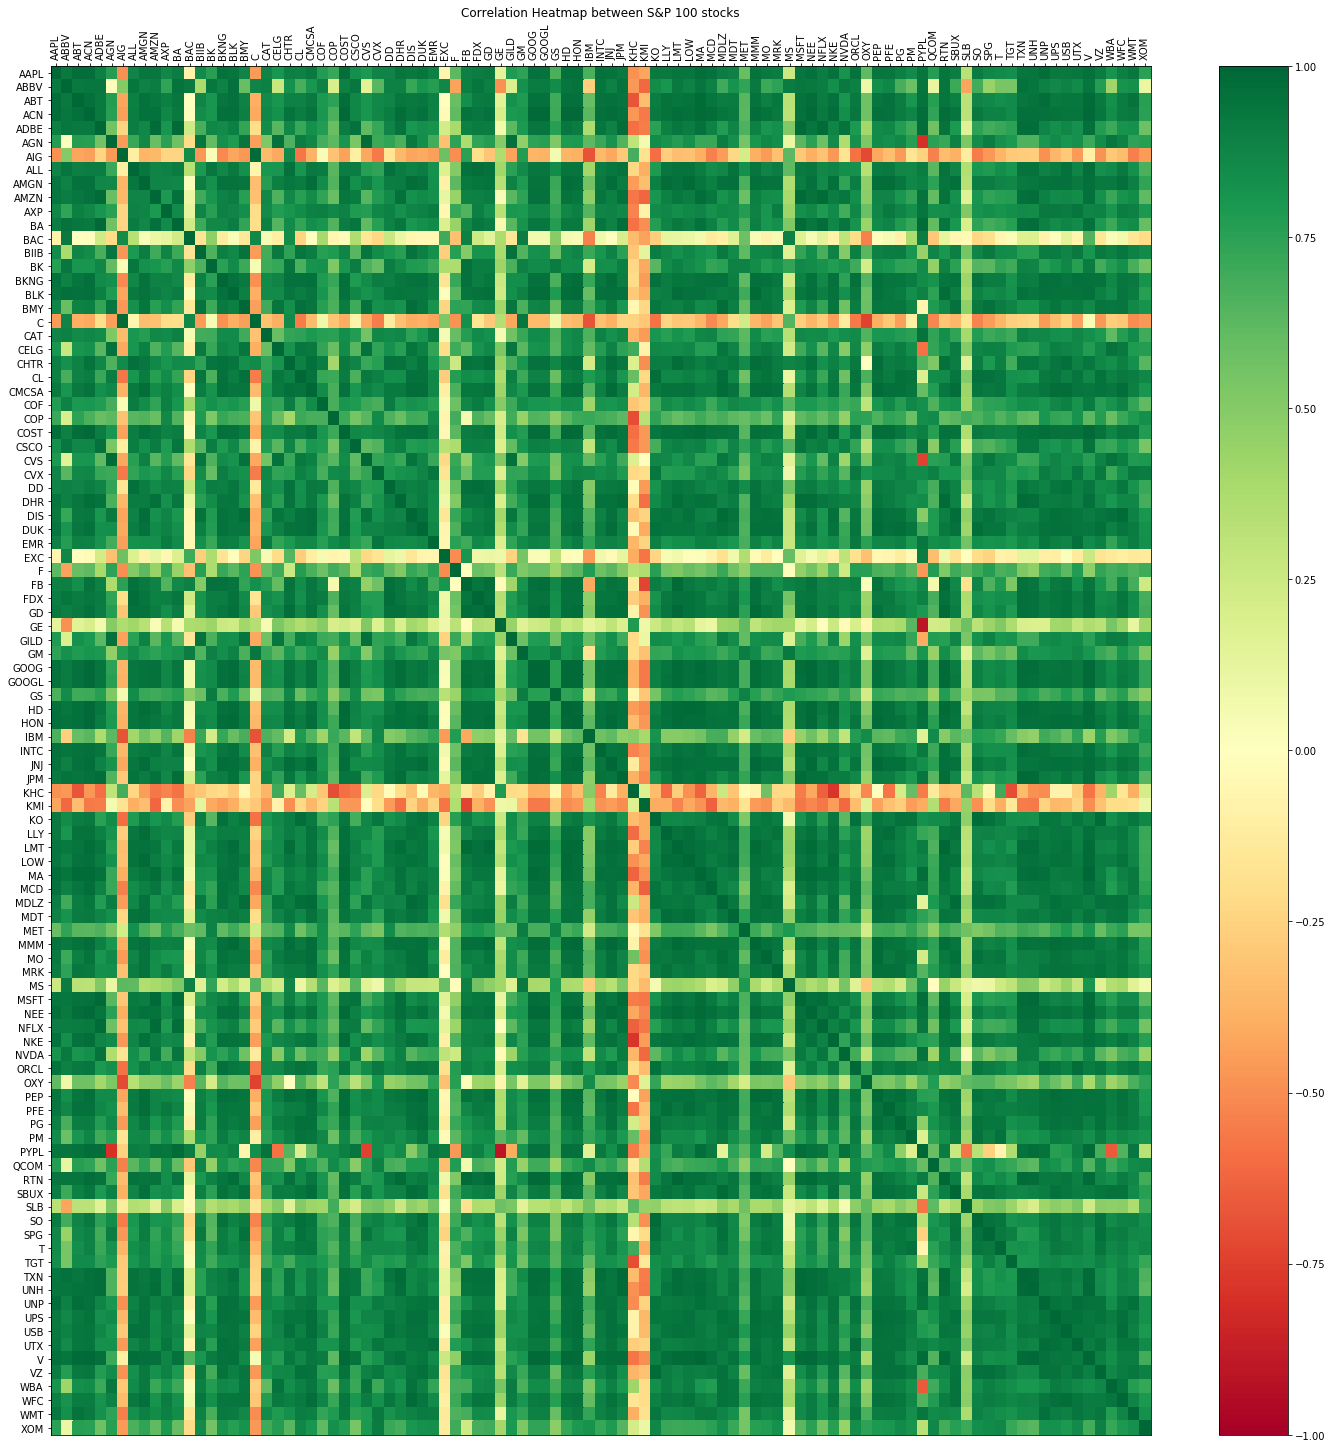
I used the Engle-Granger test to find which stock pairs in the S&P 500 index are cointegrated. The following heatmap shows the cointegrated stock pairs and the correlations between the stocks.
| Cointegration Table | Correlation Table |
|---|---|
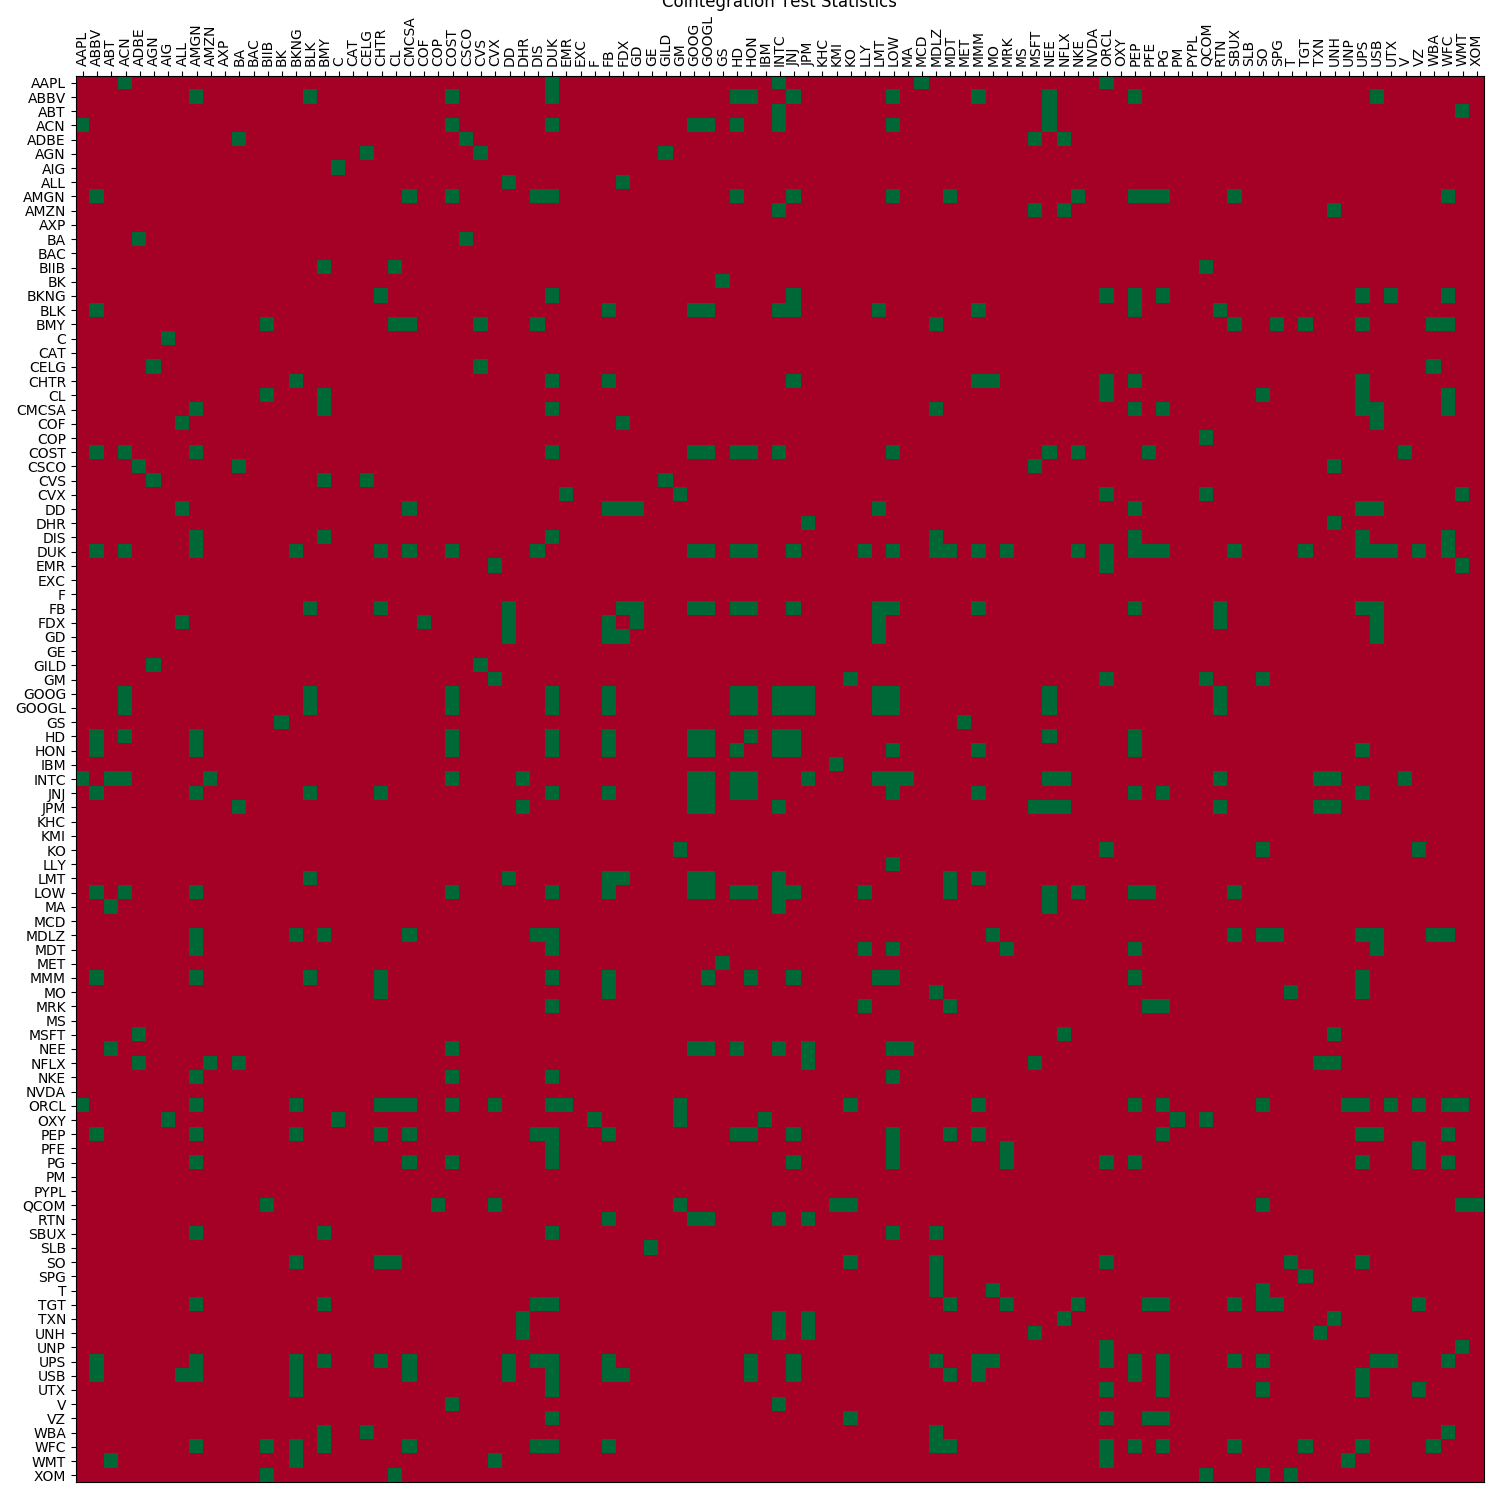 |
 |
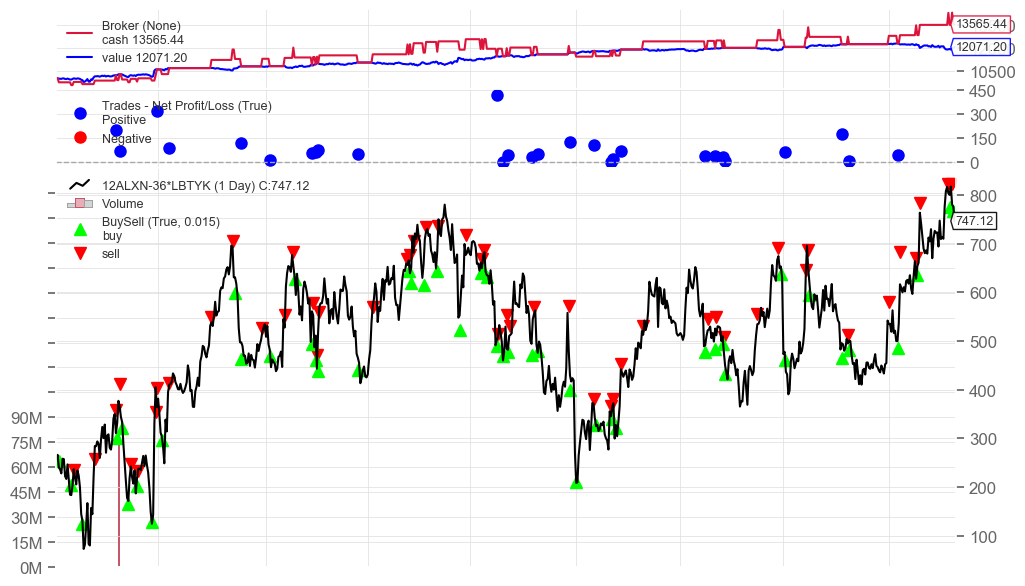
Step 2: Backtesting
Stationary portfolios were constructed using the cointegrated stock pairs. Backtesting was conducted using the Backtrader package. Trading strategy was to take a position proportional to the number of negative standard deviations away from the mean. This was done for all the cointegrated stock pairs. Below is an example of a stationary portfolio constructed using ALXN and LBTYK.
Step 3: Optimal Portfolios
Portfolio statistics were calculated using the package Quantstats. The following table shows the portfolio performance statistics of a few select portfolios.
| Portfolio | Total Log Return | Alpha | Beta | CAGR% | Sharpe | Sortino | Max Drawdown | Volatility | R2 | Calmar | Skew | Kurtosis | Expected Return | Kelly | Risk of Ruin | Daily VaR | VaR | Expected Shortfall | Daily Expected Shortfall | Payoff Ratio | Profit Factor | UPI | Win Rate | Best | Worst |
|---|---|---|---|---|---|---|---|---|---|---|---|---|---|---|---|---|---|---|---|---|---|---|---|---|---|
| 2BKNG-516SIRI | 0.3593 | 0.186246548 | -0.019374066 | 0.197292286 | 2.066886882 | 3.872781543 | -1 | 0.088981604 | 0.001059704 | 4.407068698 | 1.669768659 | 11.10107626 | 0.000714248 | 0.211842908 | 7.13E-267 | -0.0084901 | -0.0084901 | -0.014166667 | -0.014166667 | 1.376109682 | 1.638656924 | 44.11380428 | 0.543543544 | 0.0416 | -0.0236 |
| 12ALXN-36LBTYK | 0.1881 | 0.069391365 | -0.015927211 | 0.067790147 | 1.226295752 | 2.122967697 | -1 | 0.054648009 | 0.004579482 | 2.066951249 | 2.18029897 | 23.34602693 | 0.000260044 | 0.126711733 | 0 | -0.005396479 | -0.005396479 | -0.008180952 | -0.008180952 | 1.223128509 | 1.322569851 | 29.90122609 | 0.51953125 | 0.0371 | -0.0169 |
| 1BKNG-28EBAY | 0.383 | 0.130443854 | 0.023377455 | 0.136256583 | 1.177114101 | 2.164535532 | -1 | 0.113894368 | 0.002195017 | 1.462304886 | 2.092031412 | 12.96714985 | 0.000506567 | 0.108563794 | 0 | -0.011269273 | -0.011269273 | -0.016171429 | -0.016171429 | 1.323928086 | 1.283020196 | 21.16274347 | 0.492154066 | 0.0584 | -0.0278 |
| 1BKNG-14XEL | 0.2849 | 0.103988529 | -0.033480792 | 0.100061695 | 1.176661113 | 2.025693431 | -1 | 0.083966402 | 0.008284083 | 0.941565966 | 1.364697339 | 9.178137148 | 0.000378163 | 0.105857143 | 0 | -0.008308202 | -0.008308202 | -0.012008333 | -0.012008333 | 1.353892441 | 1.278676194 | 12.1729218 | 0.485714286 | 0.0345 | -0.0276 |
| 13DLTR-13MNST | 0.2791 | 0.097802086 | -0.008402164 | 0.097471163 | 1.135047157 | 2.281689462 | -1 | 0.085018494 | 0.000508911 | 1.344949693 | 3.940537441 | 36.31992824 | 0.000368813 | 0.121455442 | 0 | -0.008426343 | -0.008426343 | -0.011385714 | -0.011385714 | 1.283382602 | 1.315668956 | 21.3167903 | 0.50621118 | 0.0635 | -0.0161 |
| 13ALXN-39LBTYA | 0.1808 | 0.067935508 | -0.021311375 | 0.064888408 | 1.035792477 | 1.688967029 | -1 | 0.062517649 | 0.006264753 | 1.651215037 | 1.57631938 | 17.9527452 | 0.000249254 | 0.10421688 | 0 | -0.006220866 | -0.006220866 | -0.00964 | -0.00964 | 1.186995738 | 1.254438678 | 21.55126972 | 0.513812155 | 0.0395 | -0.0186 |
Step 4: Quantstats
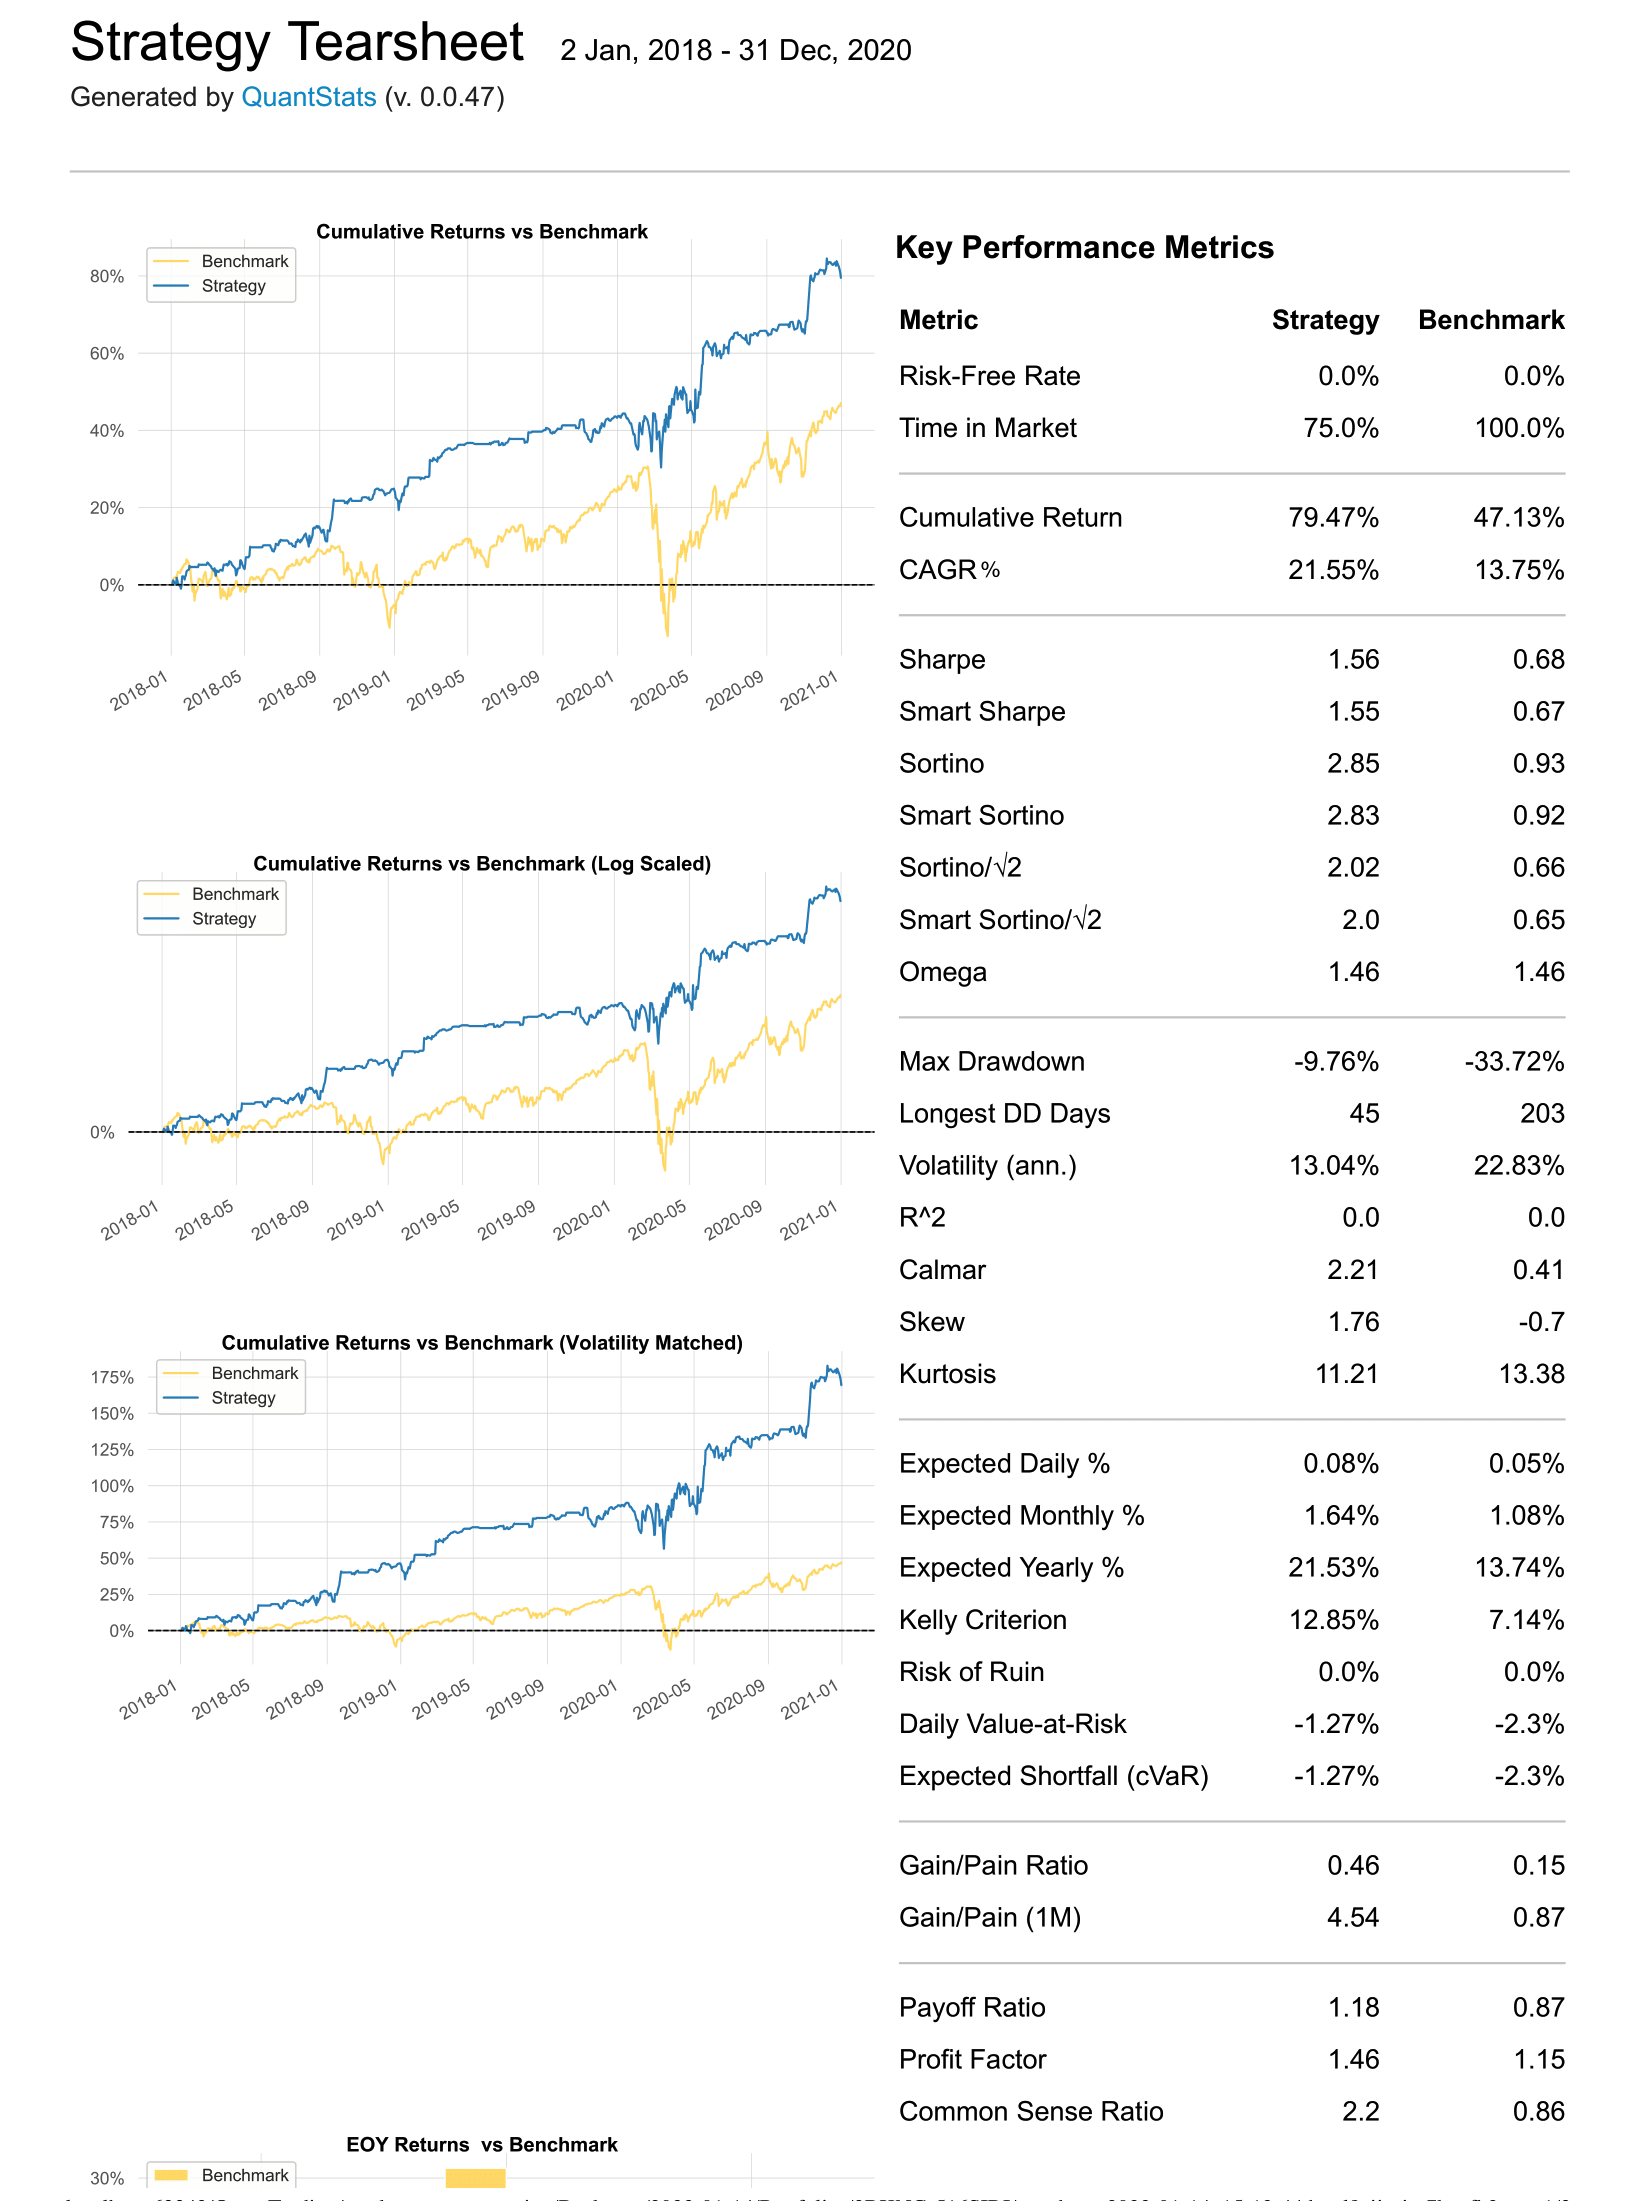
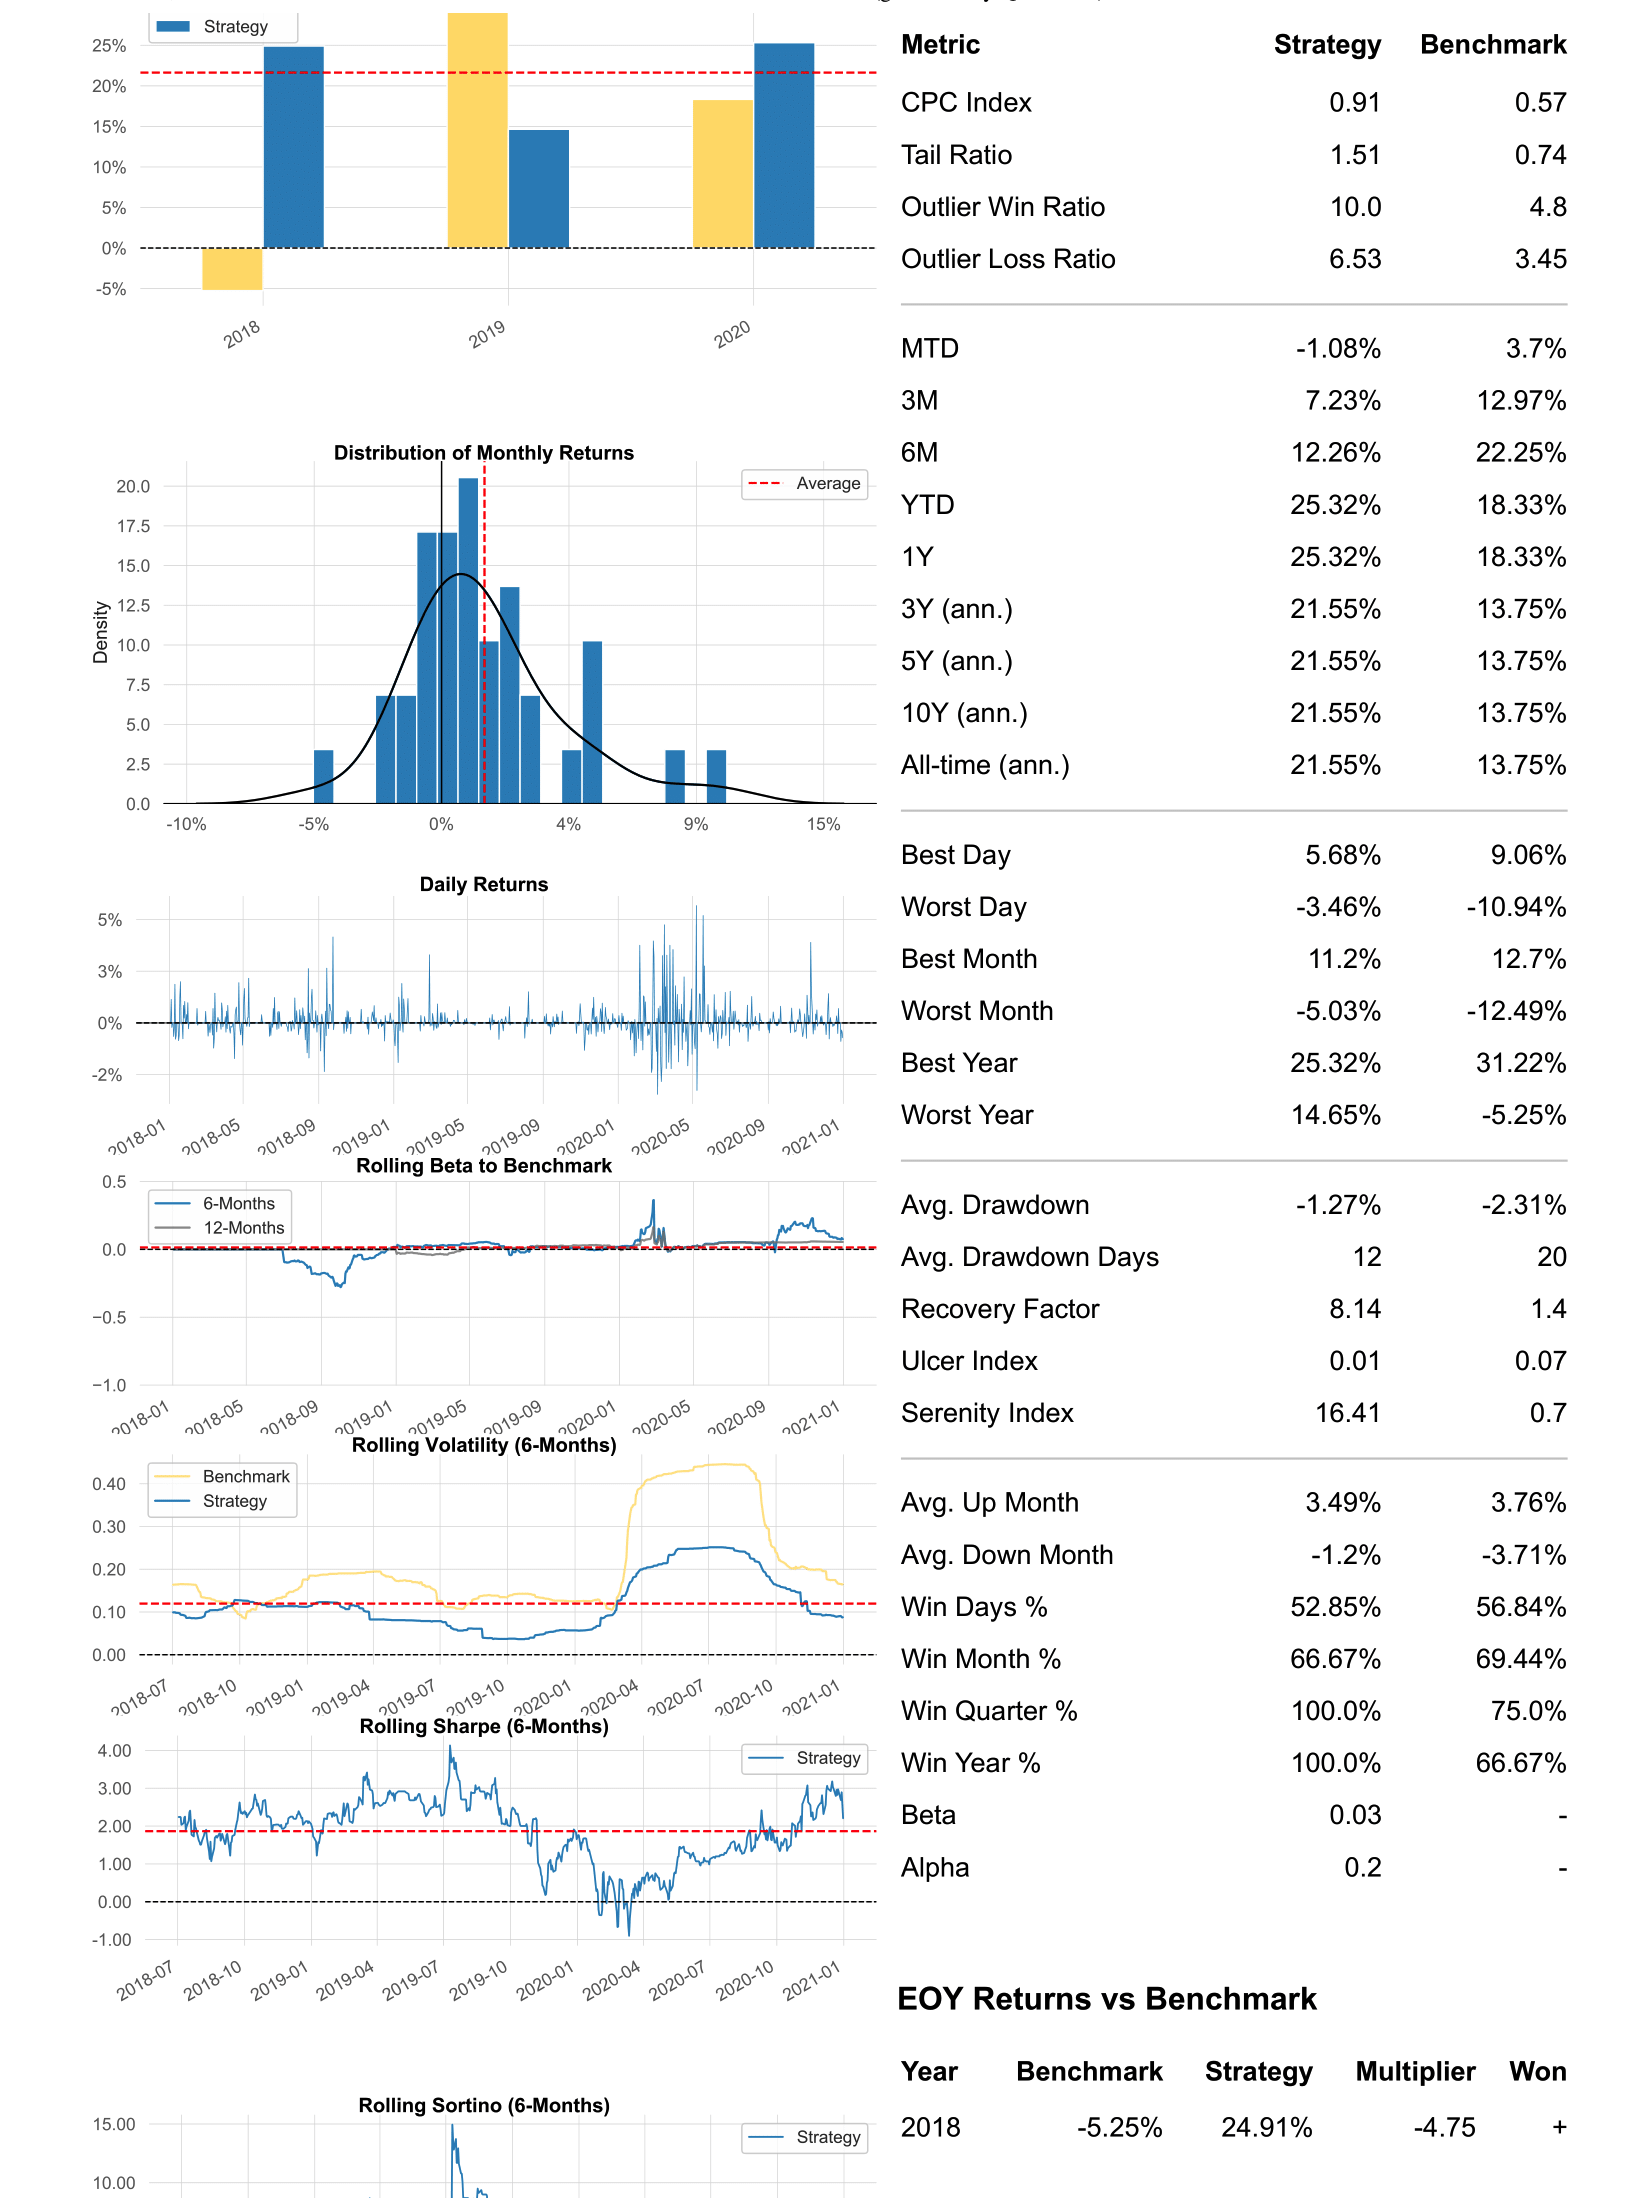
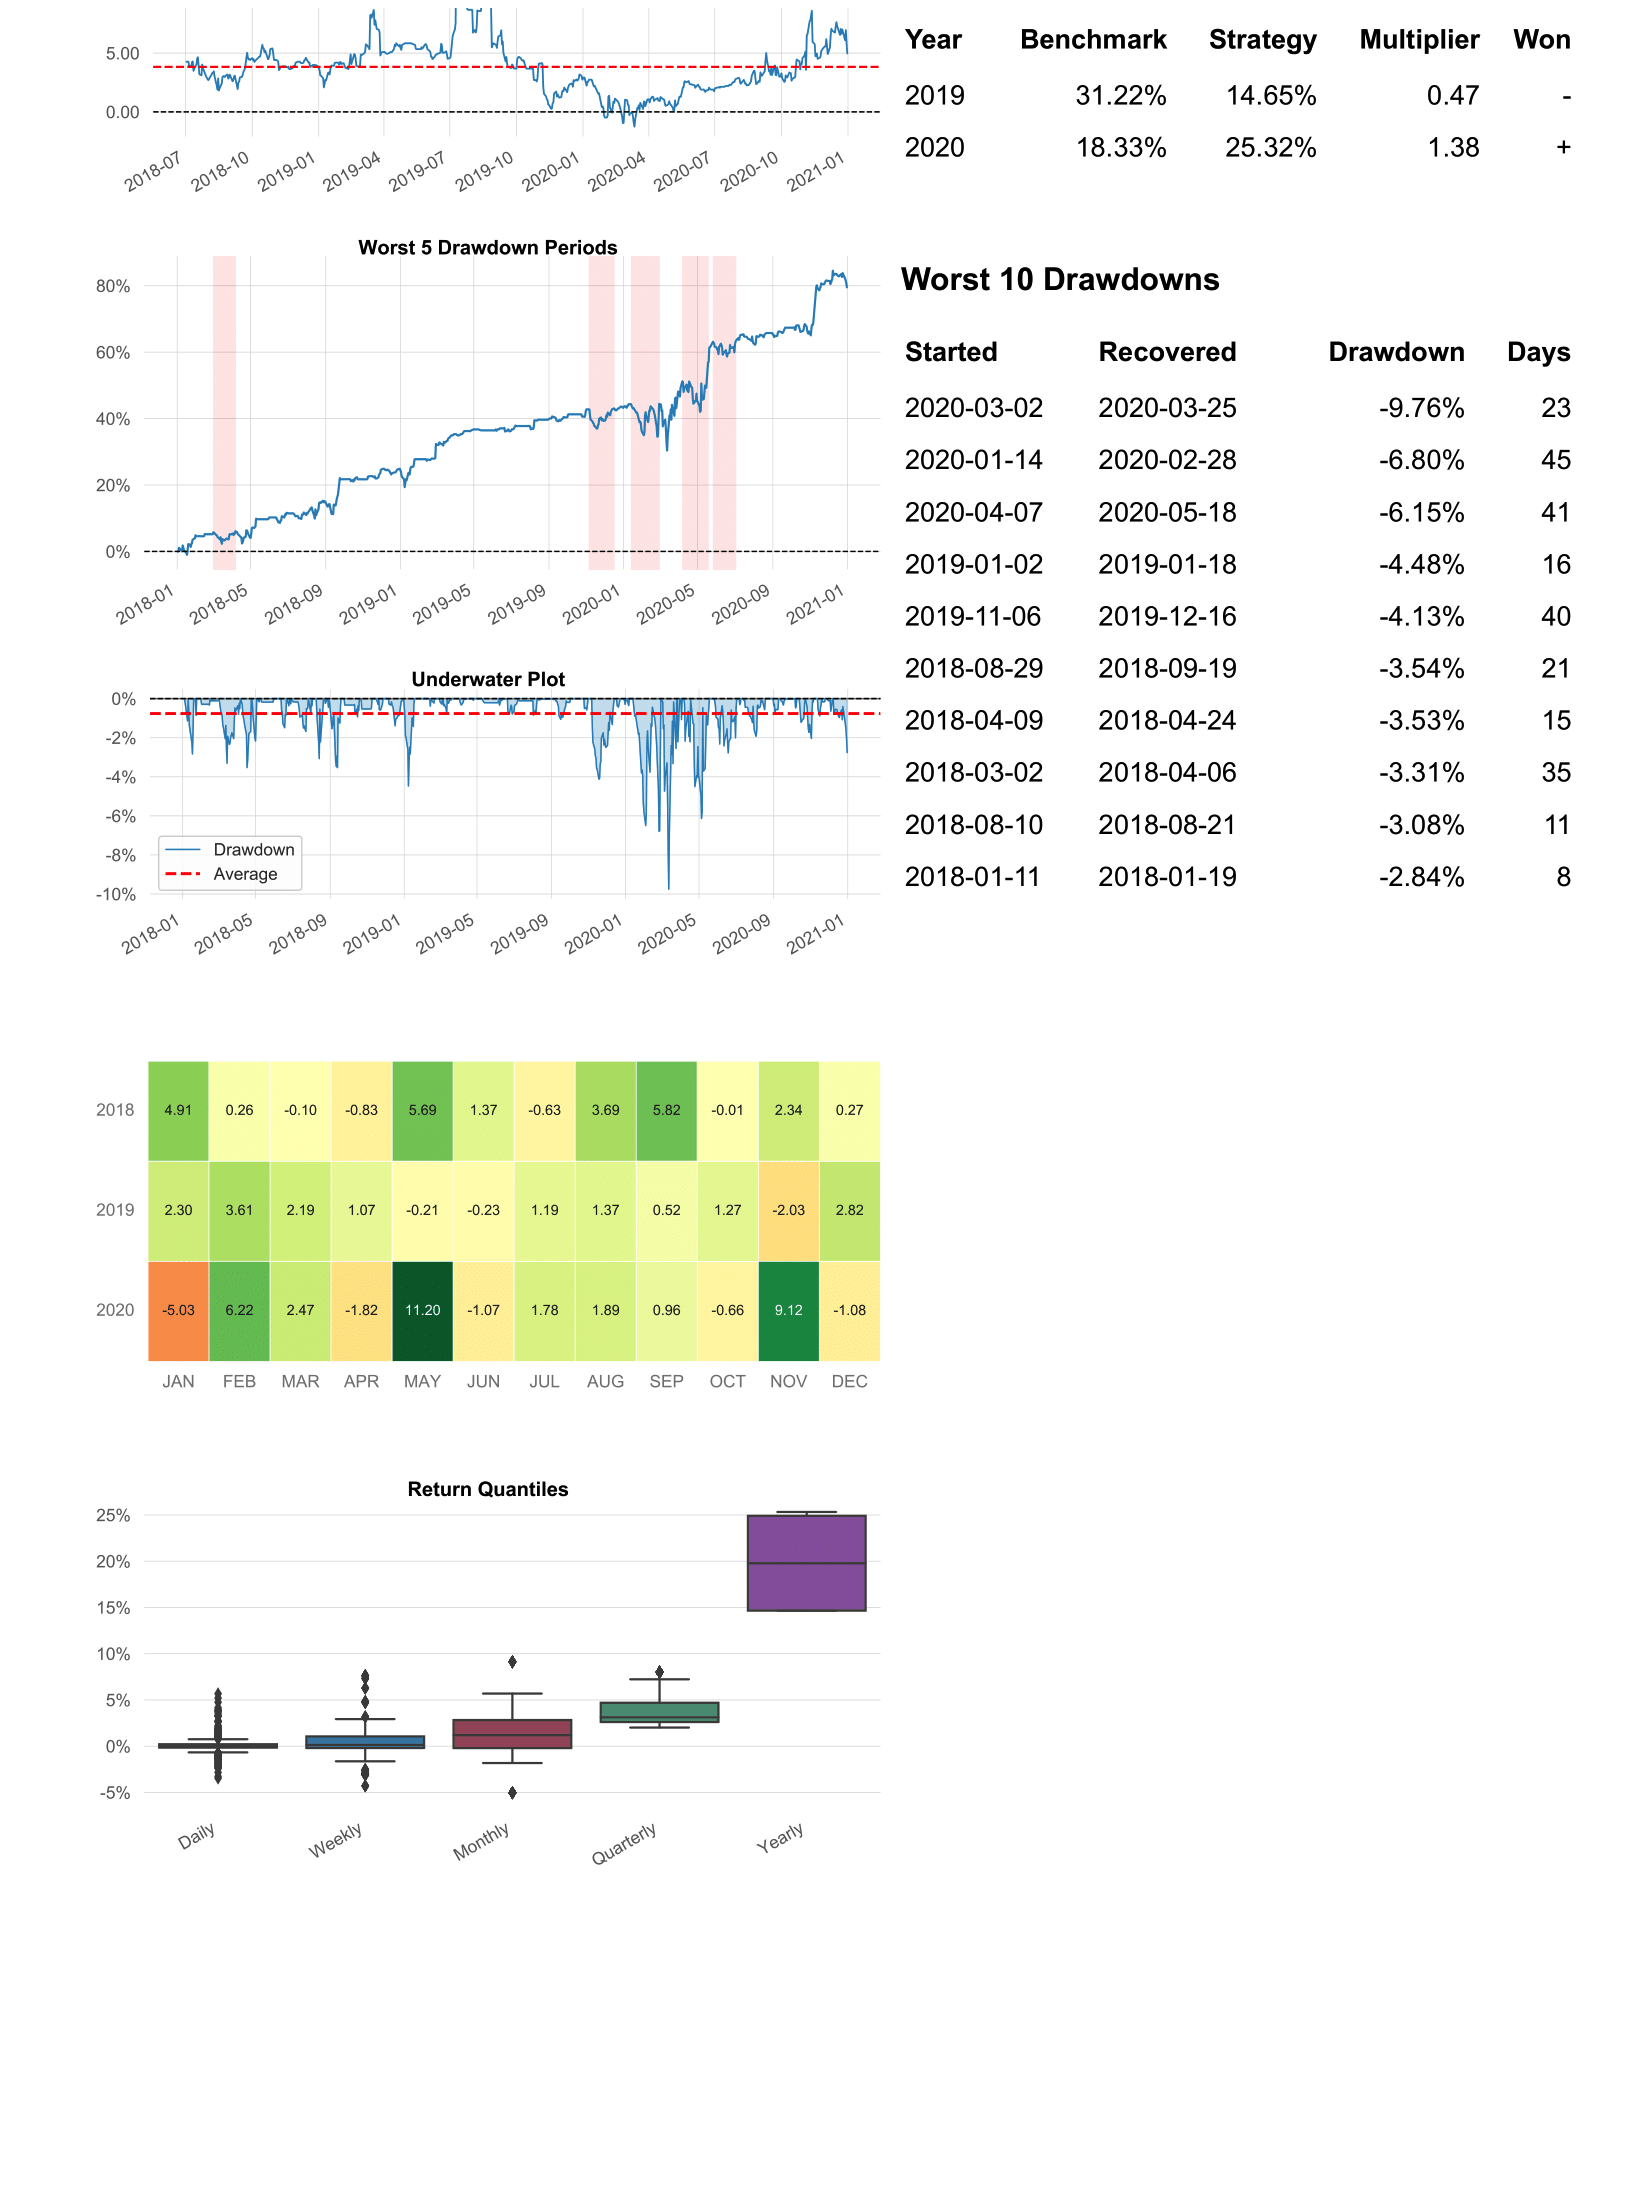
The following is an example tearsheet generated by Quantstats. Here I am showing the portfolio “2 BKNG - 516 SIRI” (long 2 shares of BKNG, short 516 shares of SIRI). The benchmark was chosen to be the S&P 500 index fund SPY.
- This portfolio outperforms the benchmark: 79.47% (compared to 47.13%)
- Sharpe ratio: 1.56 (compared to 0.68)
- Max Drawdown: -9.76% (compared to -33.72%)
- Beta: 0.03.